How to Use Lucidchart to Create a Basic Flowchart
Lucidchart is an online diagram creation tool. It allows you to build diagrams either from scratch or using one of their many templates. Lucidchart is a good choice for those users who need to make diagrams but don’t have or want to buy Visio (or you’re on a Mac and Visio isn’t available).
Making diagrams like flowcharts is very easy to do in Lucidchart. This blog post will walk you through, step-by-step, how to create a flowchart in Lucidchart from scratch. While this blog post will provide detailed explanation of the steps required to build a flowchart in Lucidchart with diagrams of each step, it is useful to provide a list of the steps upfront before we get started. Enclosed below are the list of the steps to make a flowchart from scratch in Lucidchart:
- Click on the + Document button
- Press the Flowchart button on the next screen
- Select the Blank Diagram from the list of flowchart templates
- Drag shapes onto the canvas
- Drag connectors onto the canvas and connect the shapes
- Save your flowchart by either going to File -> Save or using the keyboard shortcut (Command S on Mac or CTRL S on Windows)
Before we get started with the tutorial, if you are looking to learn more about apps like Notion, Todoist, Evernote, Google Docs, or just how to be more productive (like Keep Productive’s awesome Notion course), you should really check out SkillShare. Skillshare is an online learning platform with courses on pretty much anything you want to learn. To learn more about Skillshare and its vast library of courses and get 30% off, click the link below:
SkillShare – Online Learning Platform
Getting Started with Lucidchart
To get started with Lucidchart, head to their website:


Click the Sign up free button at the top-left hand side of the webpage.

Click the Sign Up button under the Free – Single User option
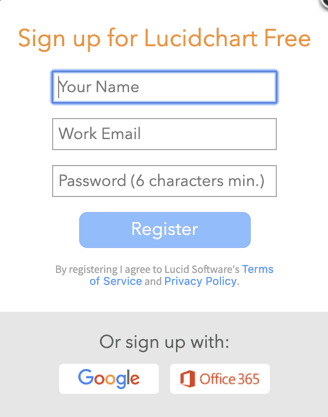
On the Sign up for Lucidchart Free screen, either sign up via email or use the Google or Office 365 login options.
Once your account is setup, you should see the welcome screen below:

Select one of the options or simple click on the Other text box and enter what way you plan to use Lucidchart.
You should now see the My Documents page below:

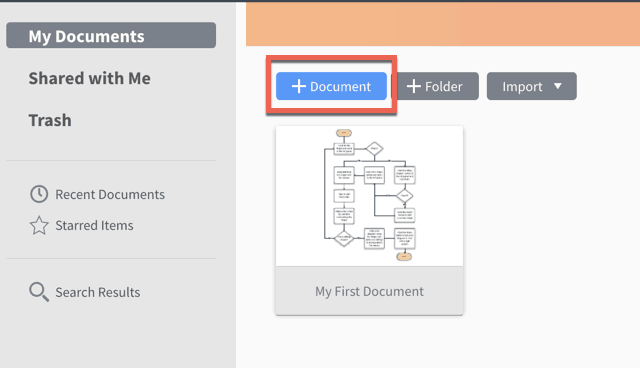
Creating a new Lucidchart Document
To create a new Lucidchart document, click the + Document button.
You should see the screen below:
Choose Blank Diagram to get started.
A new canvas should appear in your web browser window. If your view of the canvas is off-center, you can move the canvas in one of two way:
- Use the Sliders to the right and bottom of the canvas
- Right-click and hold on the canvas to drag and move the canvas around.
You can also change the view to fit the whole canvas centered in your window. To do this click on View -> Zoom to Page.
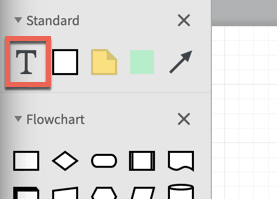
If you look at the Shapes toolbar on the left side of the canvas area, you will see four categories of shapes:

- Standard
- Flowchart
- Shapes
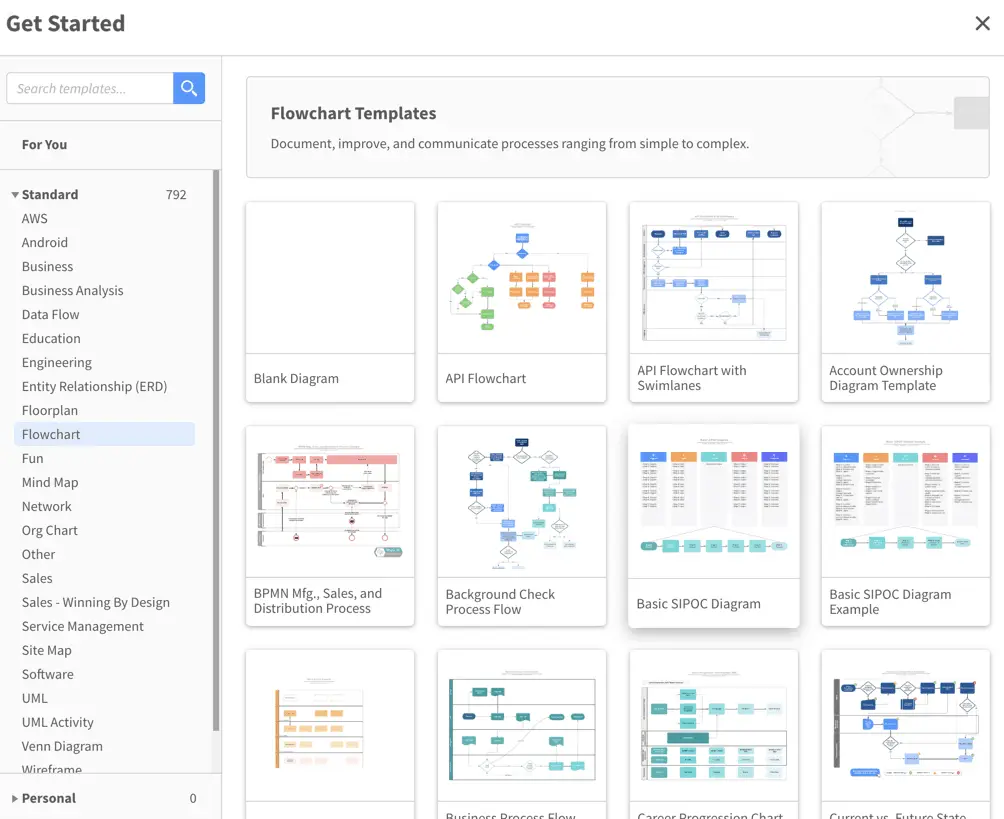
- My Saved Shapes
The first three options are somewhat self-explanatory but the My Saved Shapes option is a little different. You can drag and drop shapes from your computer to use in your Lucidchart diagram. Lucidchart supports both .vss and .vsx formats of Visio stencils, handy for those who have some Visio stencils they want to use.
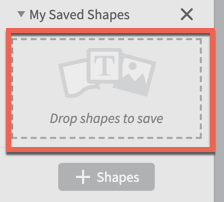
Pick a shape you want to start with. Most flowcharts start with a terminator shape (see image below). Click and drag that shape from the toolbar to the canvas and release the mouse button. You can rename the shape by double-clicking inside the shape and typing in the name you want to give the shape.
Adding Another Shape to the Canvas
Now that we have our starting shape, lets add a second shape to the canvas. Click and drag another shape and give it a name. We now have two shapes on our canvas. The great thing about flowcharts is that is shows the step-by-step process of what you are diagraming. The key is the flow between elements (or shapes) in an flowchart. To show this flow let’s add a connector.
Adding a Connector to Our Flowchart
To add a connector, do the following:
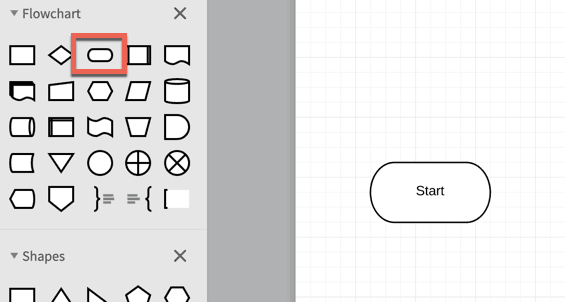
Click and Drag the Line Tool into Place Between the Two Shapes
The default orientation of the line tool is an arrow pointing from right to left. Drag it into place.
Add Another Shape and Connector
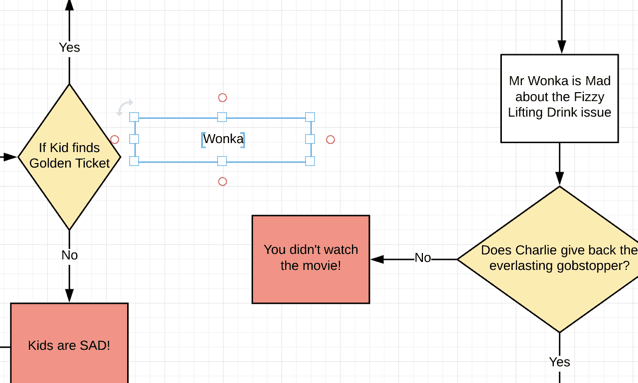
Let’s add another shape and connector. This time let’s add a decision shape. A decision shape indicates options and allows you to create branches in your flowchart.
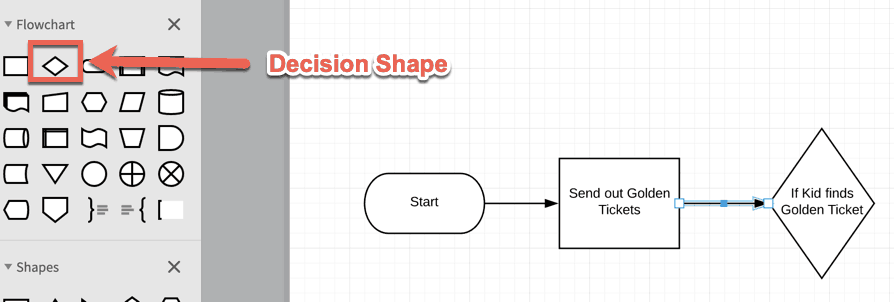
To add a decision shape, click and drag the diamond shape onto the canvas. Next drag another arrow onto the canvas connecting the second shape to the diamond. If you need to stretch the arrow, select the arrow and click on the pointed end of the arrow and drag it.
Moving all the Elements in the Flowchart at Once
Sometimes, based on the how the flowchart evolves as you work on it, your flowchart will be off-center. To move all of your elements at once while keeping the spacing and connections intact, do the following:
Select all of the Elements
This can be done in three different ways:
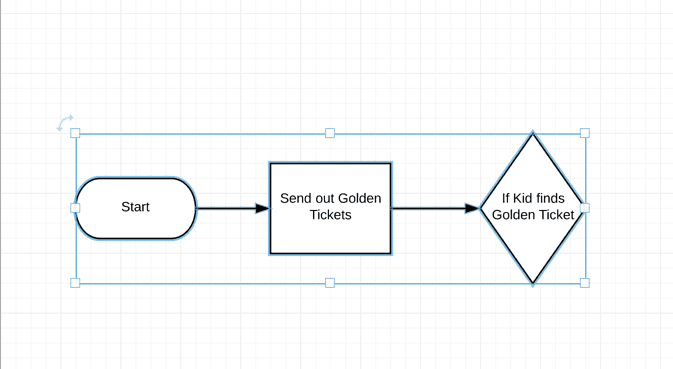
- Go to Select -> All
- Click on the canvas in the upper left of the shapes and drag to the lower right of the shapes.
- Use the keyboard shortcut (Command A on Mac, Ctrl A on Windows)
Drag the Shapes to a New Position
Once you have selected the shapes, you should see the shapes having a blue outline like in the image below:
Next, drag the shapes to their new position and release the mouse button.
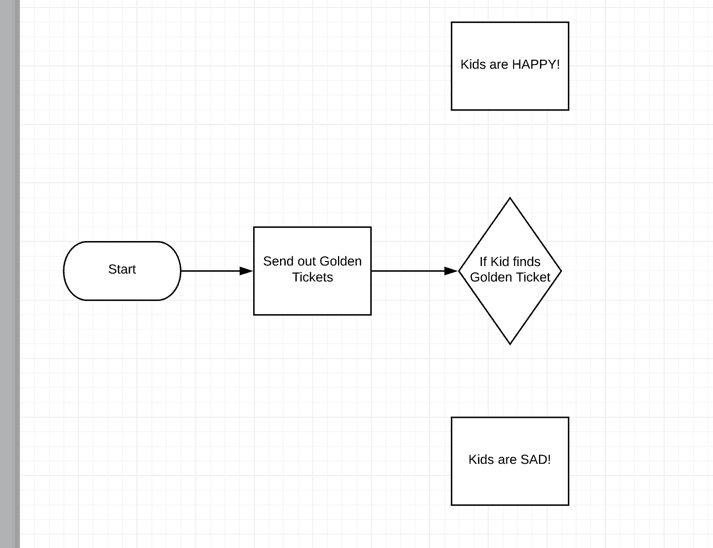
Add Elements that Connect to Your Decision Shape
Drag a new shape onto the canvas and next to (or above or below) a point on the decision shape like the image below:
Give the shape a new name.
If you plan on using the same shape for another result of the decision shape, it is easier to duplicate the existing shape. Duplicating a shape can be done in one of two ways:
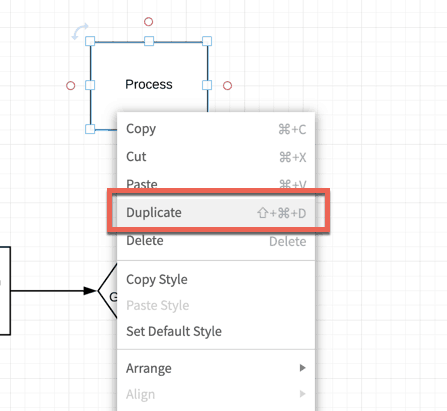
- Select the shape, right-click and select Duplicate
- Use the keyboard shortcut (Shift Command D on Mac or Shift Ctrl D on Windows)
Drag the duplicate into its position and give it a new name.
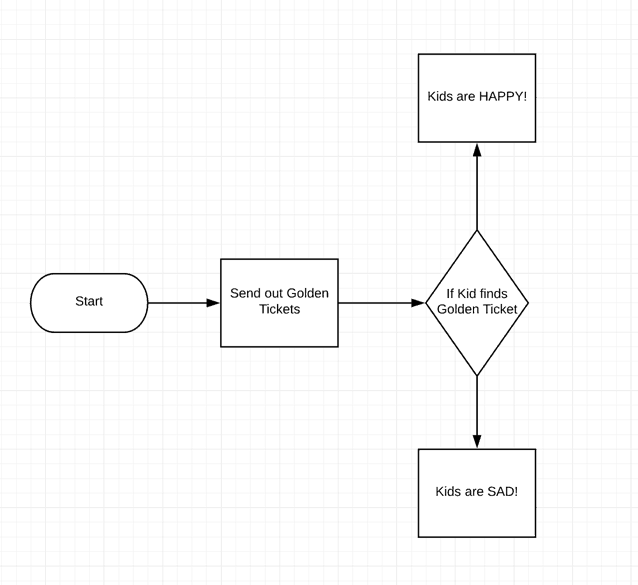
Add Connectors to each New Element and Connect to Decision Shape
- Drag a connector onto the canvas.
- Click on the white box at the base end of the arrow
- Drag it to connect to the decision point.
- Click the white box on the pointy end of the arrow.
- Drag it to the shape you just added.
- Duplicate the arrow and connect it to the duplicated shape and the decision shape
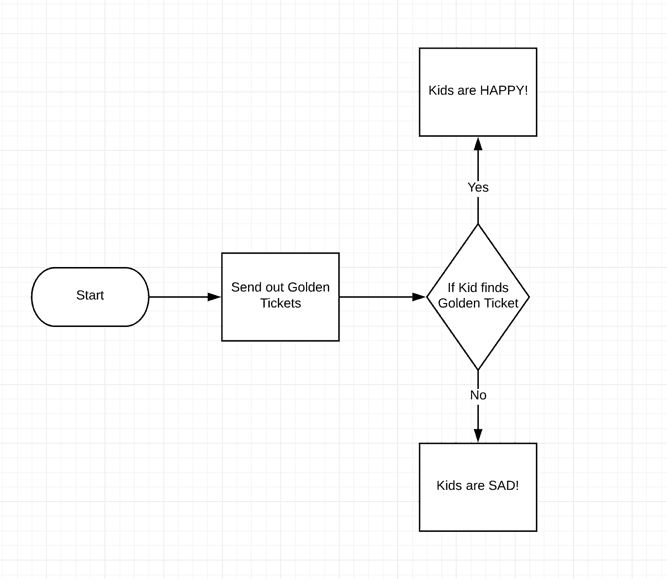
You can put add text to each arrow. Typically the names are like Yes, No, True, False, etc. To add a name to the arrow, double-click on the arrow and type in the name.
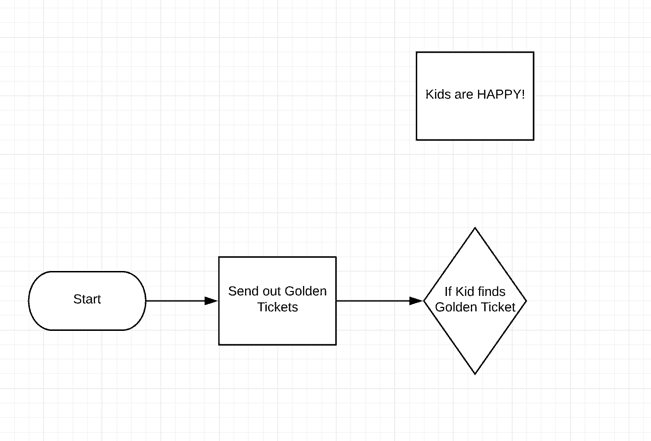
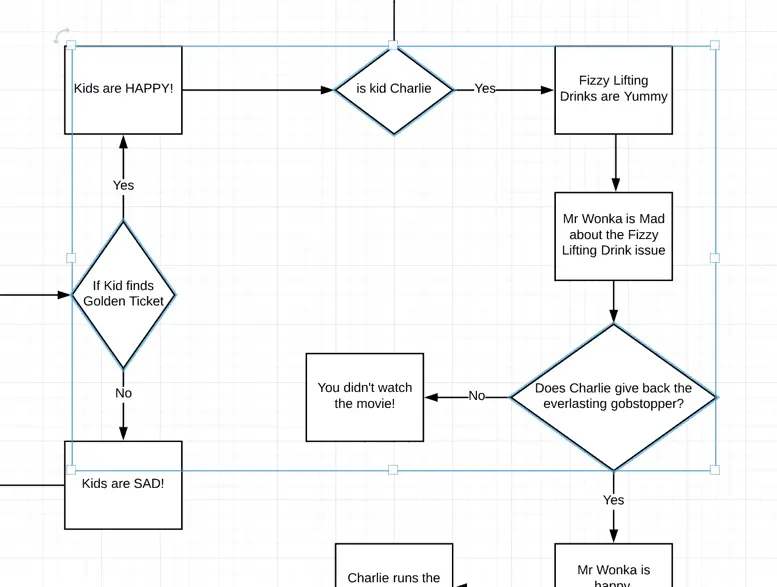
Add More Shapes and Connectors to Fill Out Your Flowchart
Add more shapes and connectors until you have all the elements on your canvas connected the way you want.
Let’s Save Our Flowchart

Now that we have the flowchart completed (at least for now), let’s save it so we don’t lose our work. To save the document, you can either:
- Go to File -> Save
- Use the keyboard shortcut (Command S on Mac, Ctrl S on Windows)
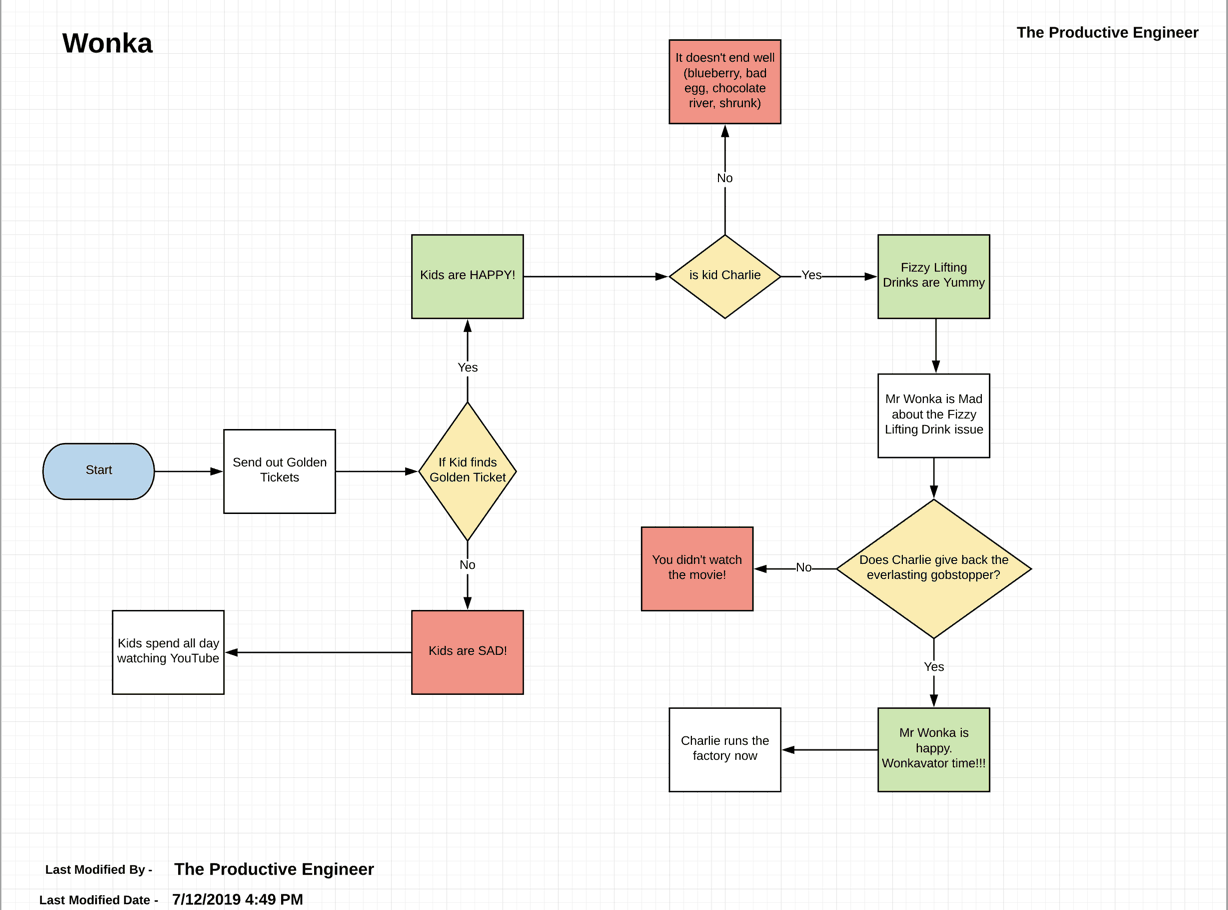
It looks kind of bland…
Now that our flowchart is complete it looks…kind of meh. While it is functional and represents what the process is, it is the visual equivalent of generic. One way we could make it more visually appealing is to add color to some of the blocks.
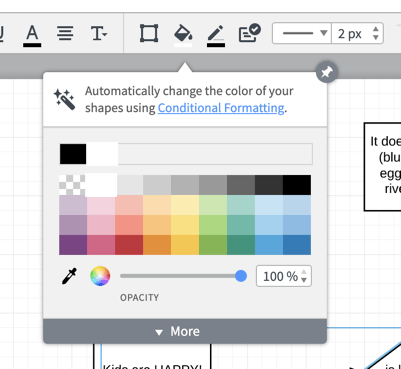
Let’s add color to the decision blocks, to add color to a block, do the following:
- Hold to Shift and click on each decision block to select it.
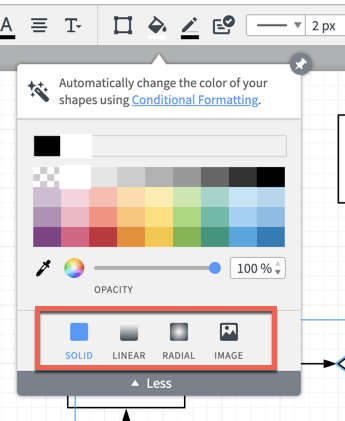
- Click on the Color Bucket in the Editing Menu above the canvas
- Select your color from the color picker
Our flowchart looks a little more interesting now. Let’s some more color. Let’s do the following:
- Make the Start blue
- Make all the Yes outcomes green
- Make all the No outcomes red

The flowchart should look much better now but we can do more.
Adding the Title and Author
Adding the name of the document is easy and doesn’t require you to manually type it in.
To add the name of the document to the canvas:
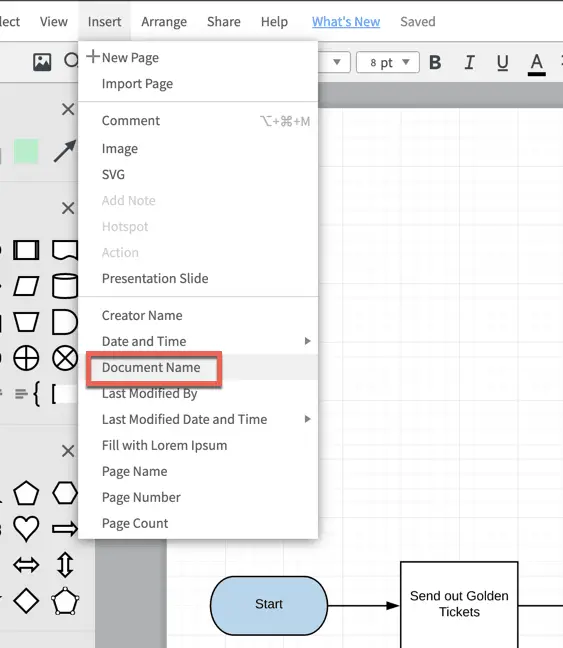
- Go to Insert -> Document Name
The document name will be placed in the middle of the canvas. It should be moved and we should make some changes to font size and bolding it.
Click and drag it to where you want it. To change the font size and to bold it, do the following:
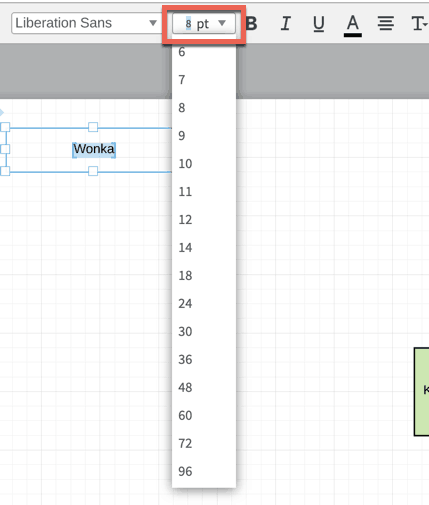
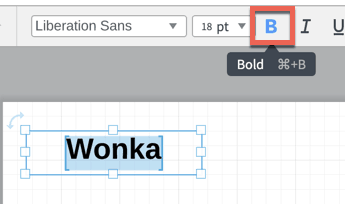
- Double-click the text.
- Click on the font size drop-down menu above the canvas and select the font size you want
- Click on the Bold button

Your Title should now be the size you want and bolded.
To add the author, do the following:
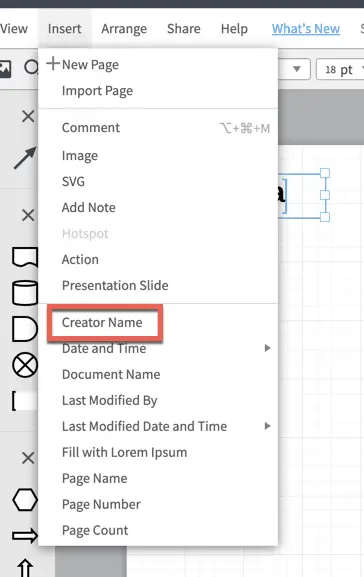
- Go to Insert Creator Name
- Move the name from the middle to where you want it
- Change the font, font-size and bolding as you want it

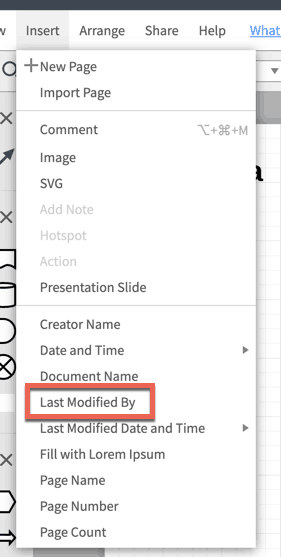
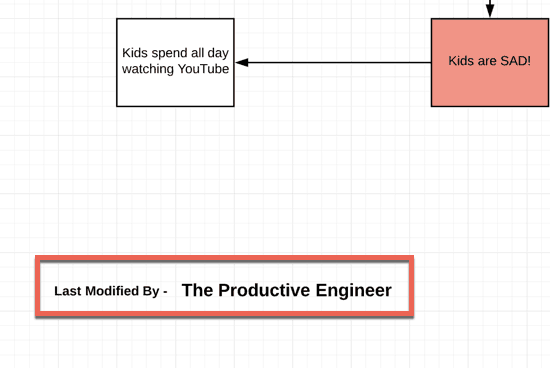
Now that we have added the author, let’s add the last modified by and last modified date.
Adding the Last Modified By
To add the last modified by, do the following:
- Go to Insert -> Last Modified By in the main menu
- Move the Last Modified By text box where you want it and edit the style
It is a good idea to add some text before or above the Last Modified By.
Adding Text Box to Canvas
To add a text box to the canvas, do the following:
Drag the Text Box onto the canvas above or next to the Last Modified by text box
Double-click on the text and style and position the text in the text box accordingly
Adding the Last Modified Date
To add the last modified date, do the following:
Go to Insert -> Last Modified Date and Time -> [date/time]
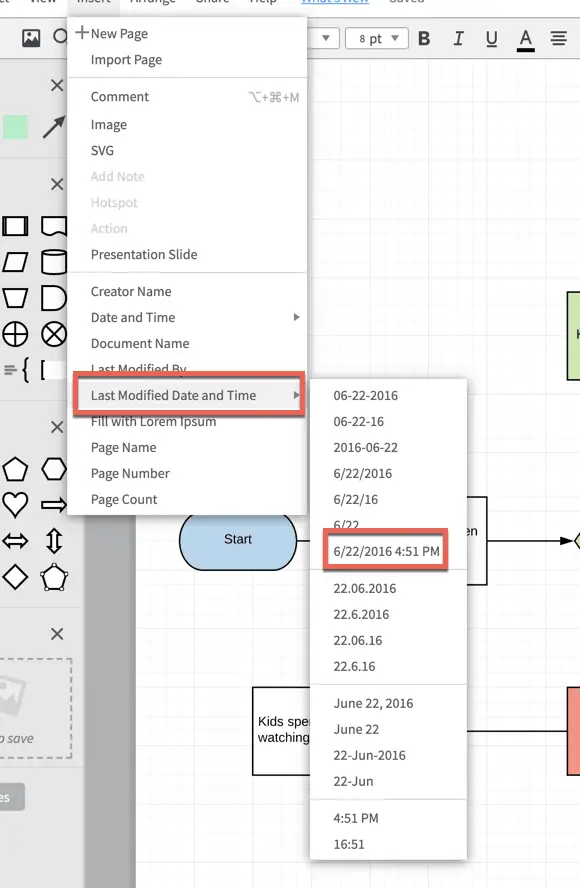
Move the date/time text box to where you want it and style it. Add another text box as a label.

Our flowchart is now complete. Don’t forget to save. Now let’s download our flowchart.

How to Download a Flowchart from Lucidchart
To download a flowchart or diagram from Lucidchart, do the following:
Go to “File -> Download As -> [PICK FORMAT]”
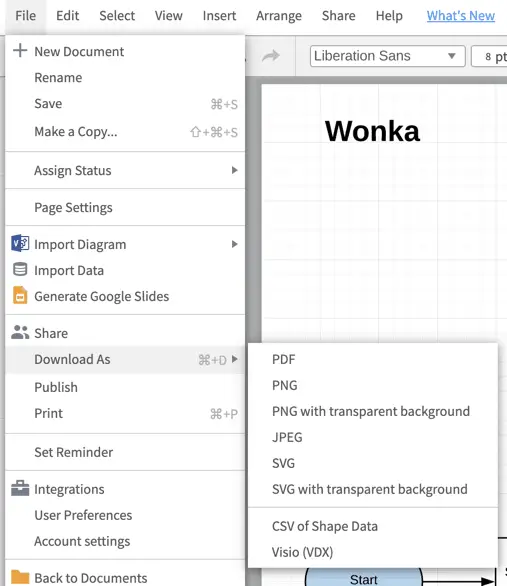
You will be presented with the following formats:
- PNG
- PNG with transparent background
- JPEG
- SVG
- SVG with transparent background
- CSV of Shape Data
- Visio (VDX) (note that Visio import/export is only available with the Pro and Team subscriptions)

If you are looking to put your flowchart into powerpoint, use the PNG with transparent background option. If you are looking to just distribute it, go with the PDF option.
How to Share a Flowchart or Diagram in Lucidchart
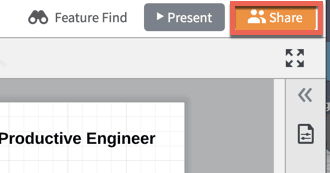
Lucidchart offers the ability to share your flowchart or diagram directly from Lucidchart. Sharing can be done in a variety of ways such as:
Sharing via Shareable Link
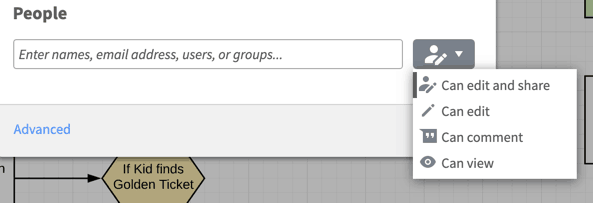
The easiest way to share is via Shareable Link. Shareable link allows you to create a unique URL that can be shared with anyone. You can control the levels of permissions on the link. The three levels of permissions are:
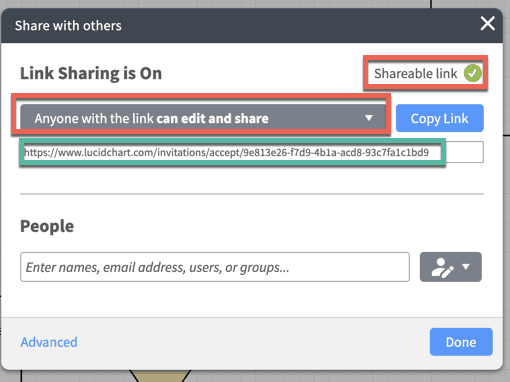
- Off – only allow specific people access
- Anyone with the link can edit and share
- Anyone with the link can edit
- Anyone with the link can comment
- Anyone with the link can view
I typically don’t like using the shareable link option. It is too all or nothing for me and I would only use it for view only or comment only access. But it is a convenient way to give anyone access. Just be careful with the permissions.
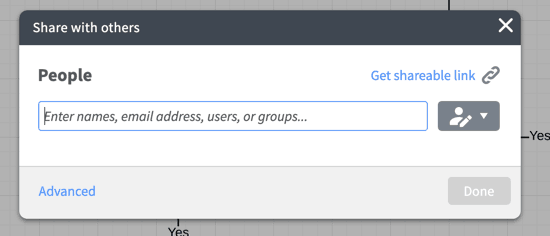
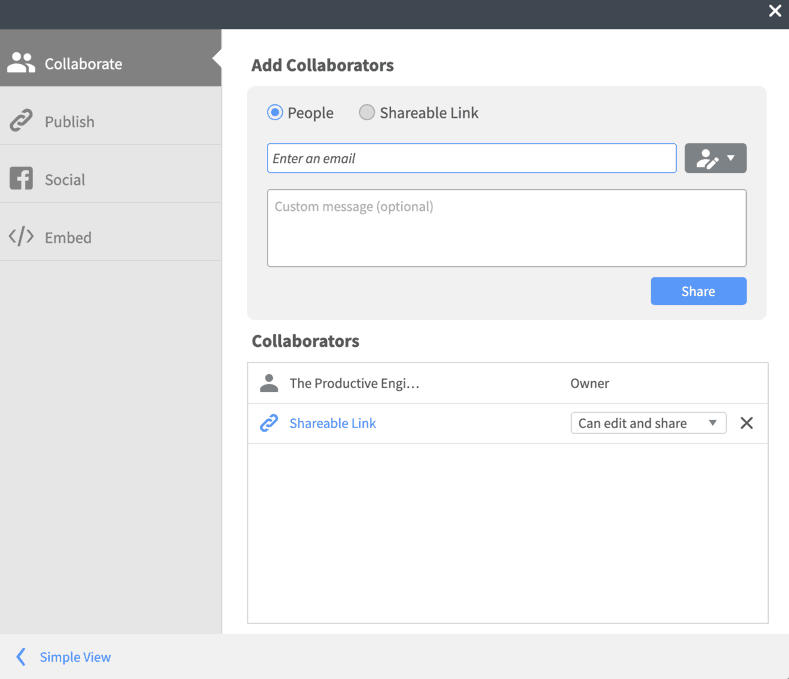
Sharing by Person
The next option, and the one I typically use, is the sharing by person option. This option allows you to assign permissions on a per user basis.
As you add users you can view them and their associated permssions in the Collaborate tab. To get to the Collaborate tab, click on the Sharing button. When the Sharing window appears, click on the Advanced button in the lower-left hand corner of the window.
Sharing via the Publish Feature
Lucidchart allows you to generate a link that provides access to the document in several formats. The formats available are:
- Full Document (URL)
- Full Document (PDF)
- Single Page (PDF/image)
- Area Selection
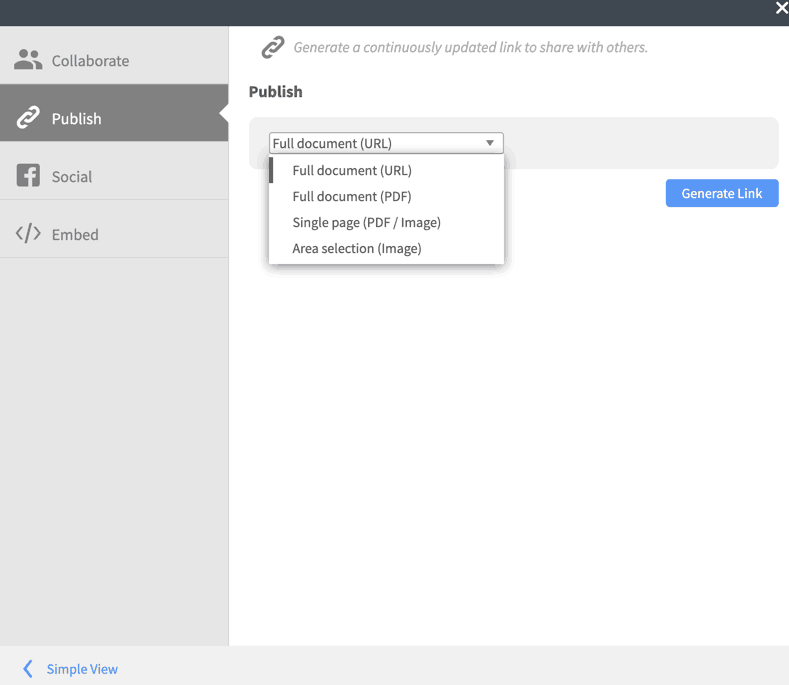
The neat thing about using the Publish feature is that you have control over the format the users can see. You can also limit access to a single page or even an area within a page.
Sharing to Social Media
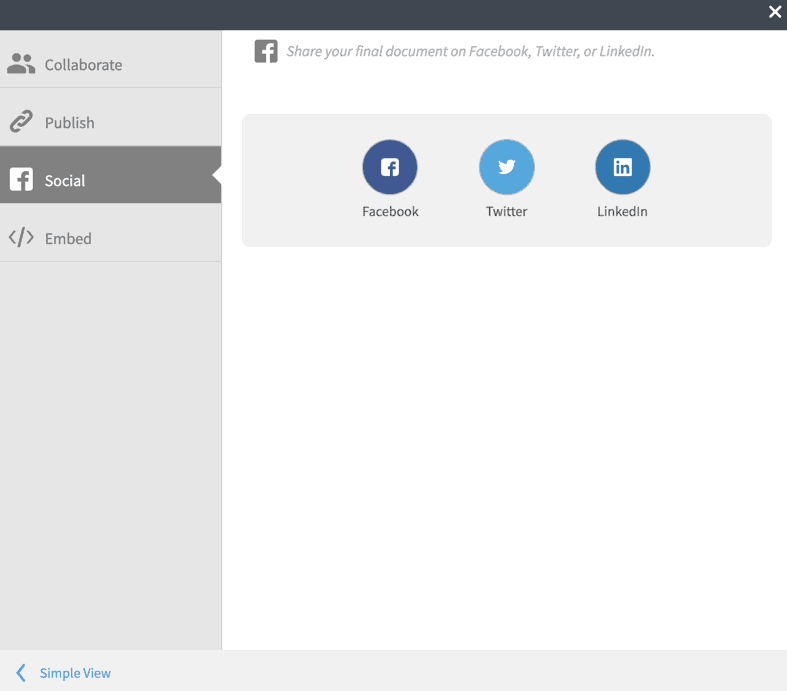
This option allows you to share your diagram to Facebook, Twitter or LinkedIn.
Embed
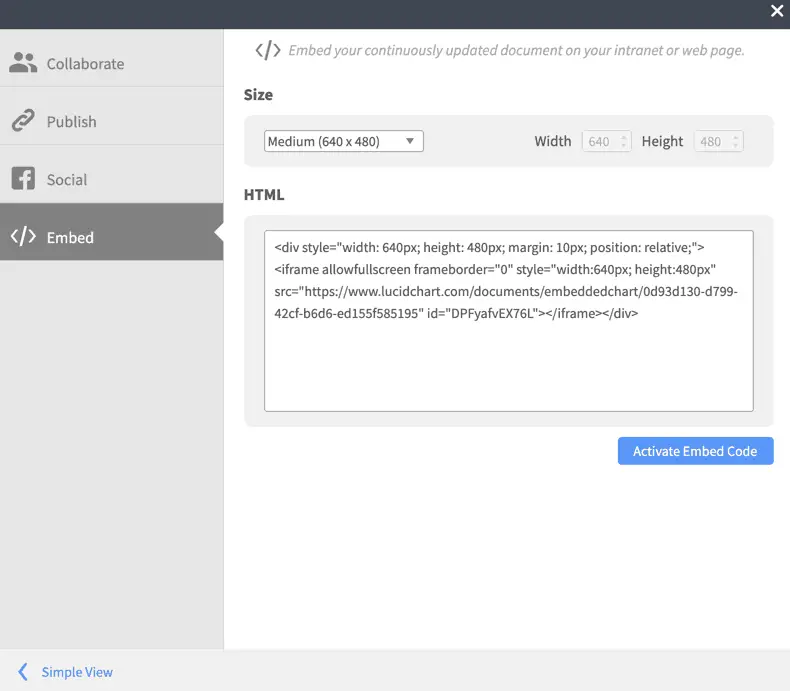
This option is interesting in that it allows you to embed your diagram into a web page. If you have a webpage where you want to embed your diagram, all you need to do is press the Activate Embed Code button and copy and paste the HTML into your webpage. I use Notion, which is essentially a wiki service and the idea of being able to embed my flowcharts into Notion is appealing.
Lucidchart Pricing Model


Lucidchart uses a “Freemium” subscription model that is actually quite reasonable in my opinion. The free option will likely be good for most people. The Pro subscription includes unlimited documents, shapes and 1GB of storage but the main feature is the Visio import/export functionality. The team option includes everything in Pro plus integrations to third-party applications and services while Enterprise offers Team functionality plus group management, SFDC (Salesforce) integration and LinkedIn Sales Navigator support.
Check out our Resources page
Check out our resources page for the products and services we use everyday to get things done or make our lives a little easier at the link below:
Summary
Lucidchart is a good solution for independent workers who are looking to build diagrams without purchasing Visio (or Omnigraffle on Mac). It has good feature set and a variety of download and sharing options. It can (in the Pro, Team and Enterprise subscriptions) import and export Visio files, which is the default diagramming application in many businesses. It has a ton of templates and shapes to get started with plus you can import Visio stencils, expanding the amount of digital assets available to you. Building a flowchart in Lucidchart is very straight-forward. Please comment in the comments section if you would like more tutorials on Lucidchart.
Please Subscribe to our Newsletter
If you like the content on this site, please subscribe to our newsletter. We promise not to be spammy!
Subscribe Form
Helpful Links
Lucidchart resource page
link to Lucidchart resource page
Lucidchart Pricing Page
link to Lucidchart pricing page
Other Articles You Might Be Interested In
How to Create a Mind Map on a Mac
link to How to Create a Mind Map on a Mac
How to Embed a Google Sheet in Notion
link to How to Embed a Google Sheet in Notion
How to Create a Template in Todoist – An Illustrated Guide
link to How to Create a Template in Todoist – An Illustrated Guide