How to Split a Table in Google Docs – Complete Tutorial with Screenshots
You’re adding a table or a chart to your Google Doc and would like to add even more information. Is there a way to quickly split a cell without redesigning the entire table? How can you quickly add columns and rows within a table in Google Docs?
To split a table in Google Docs, the user must right-click the cell they would like to divide further. The user must then select “Split Cell” from the given options, input how many rows and columns are to be created from the initial cell, and select “Split.” Other techniques can be utilized to get the most out of tables in Google Docs.
Keep reading to learn more about how and why you may wish to split tables in Google Docs and how to get the most out of tables in Google Docs.
How to Split a Google Docs Table?
To split a table in Google Docs, do the following:
- Open Google Docs to the document containing the table you want to split
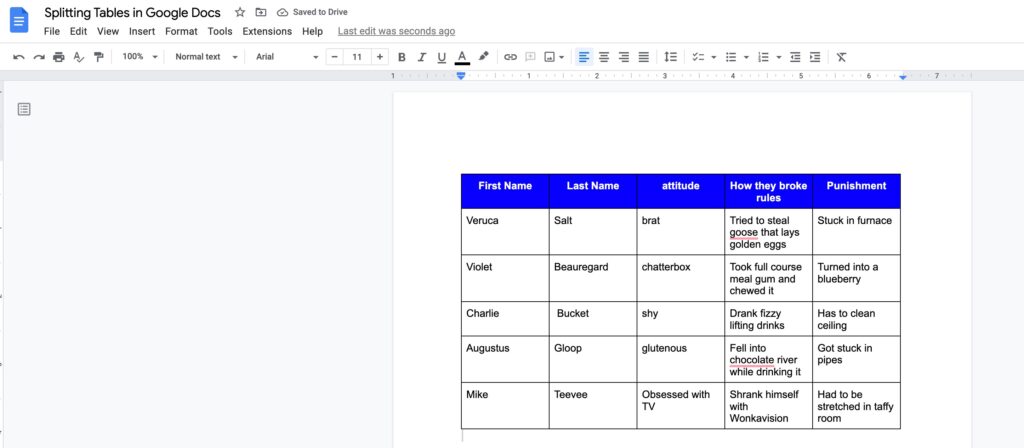
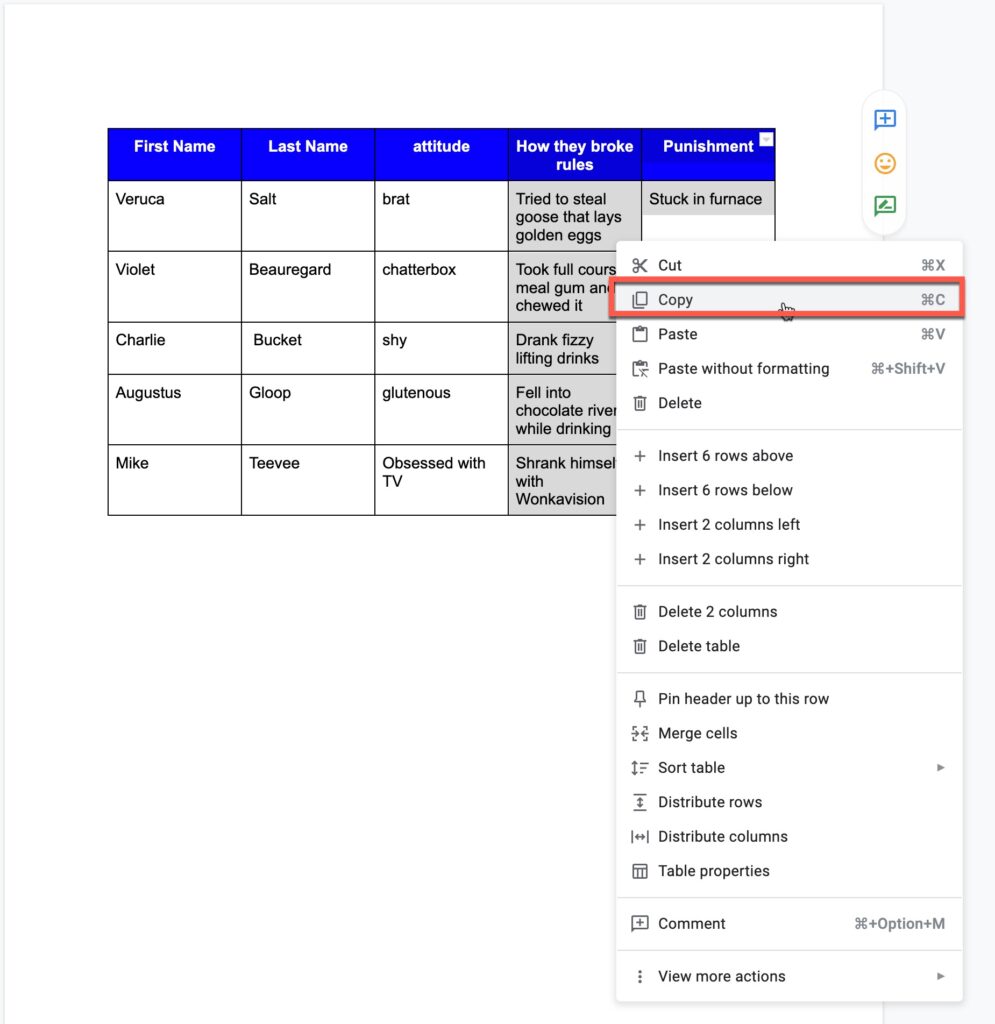
- Select the Rows and/or Columns You Want to Split into a new table by clicking and dragging your mouse across the rows and cells you want
- Right-click and select “Copy” from the available menu options, as shown in the screenshot below
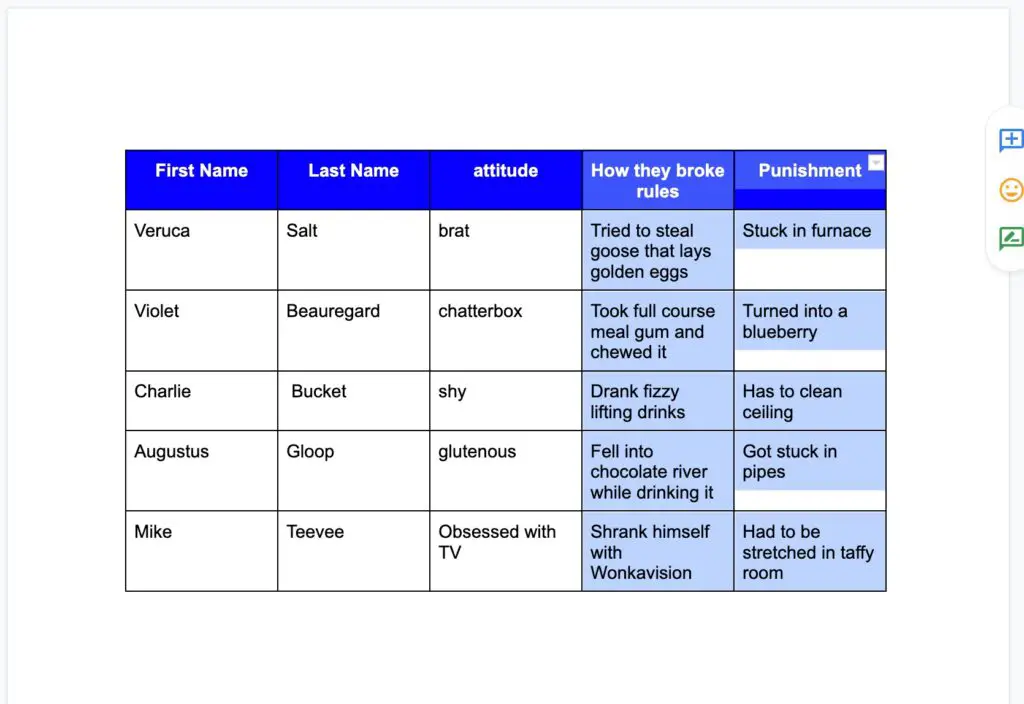
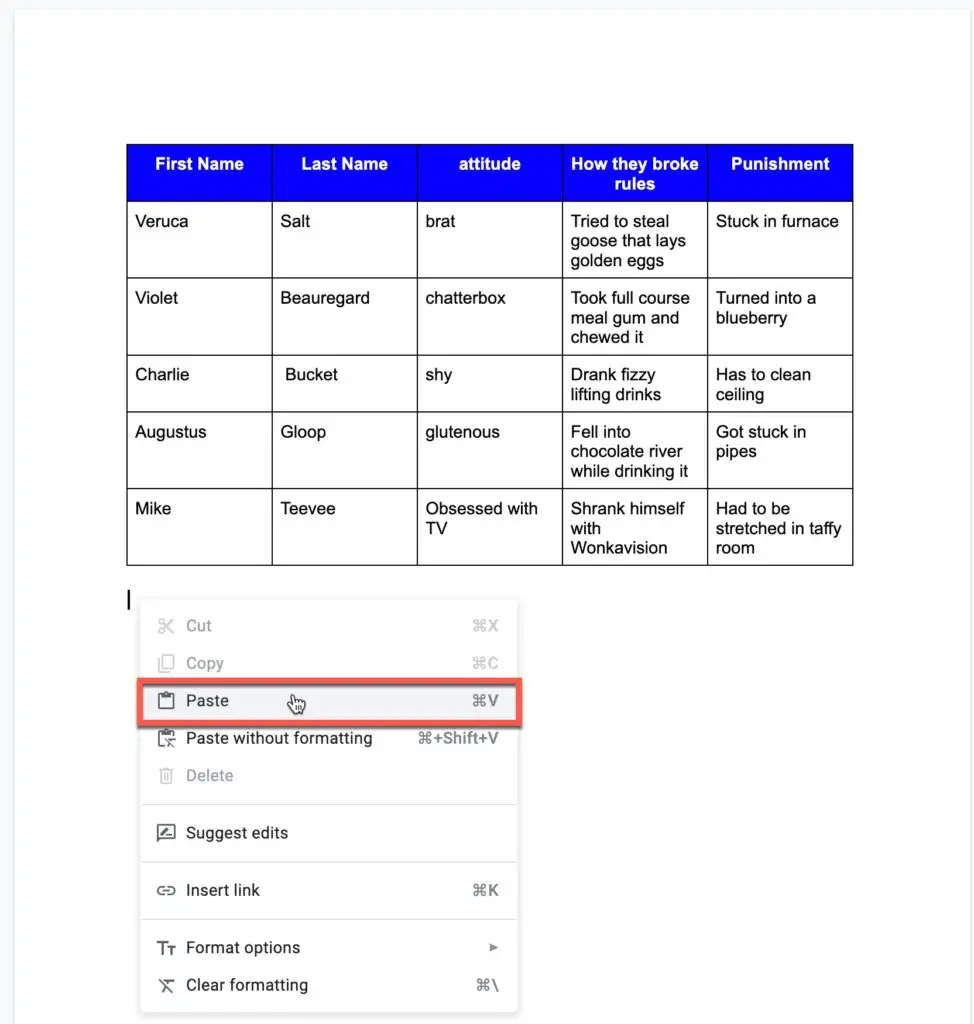
- Click where you want the new table to go, right-click and select “Paste” as shown below
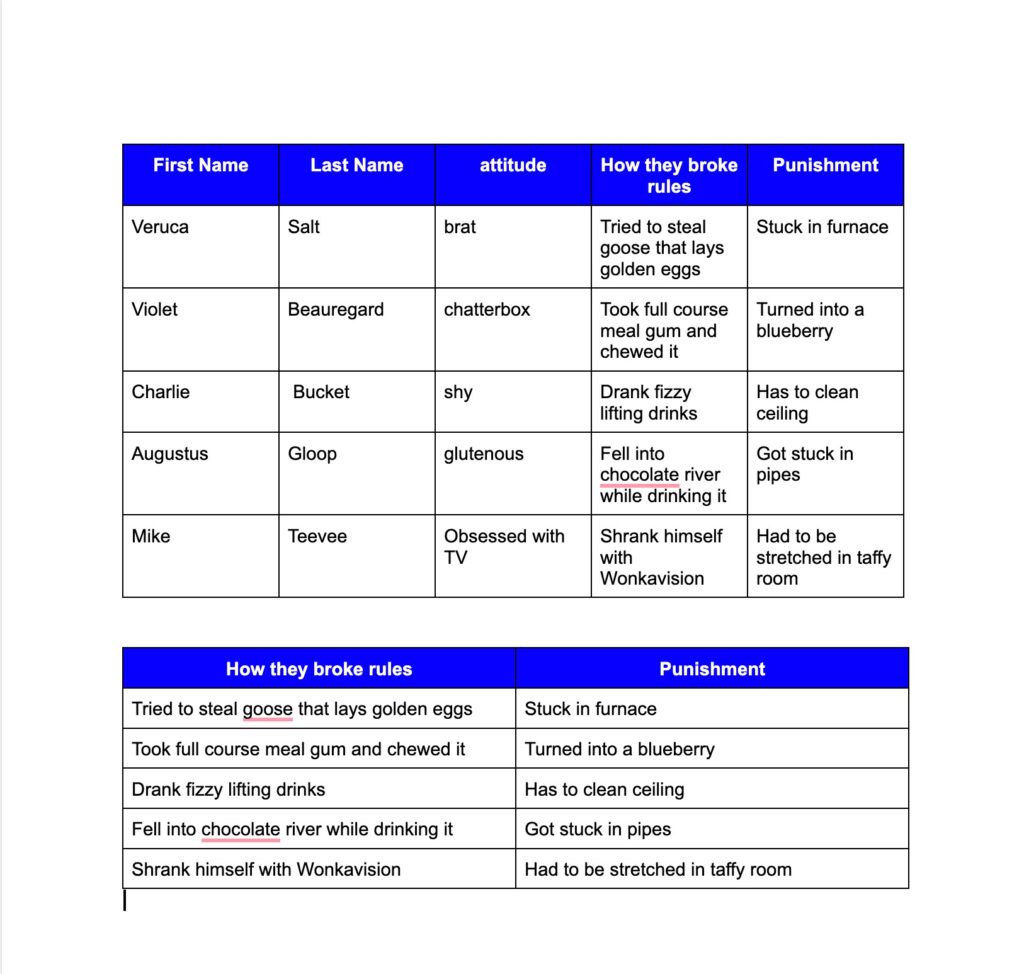
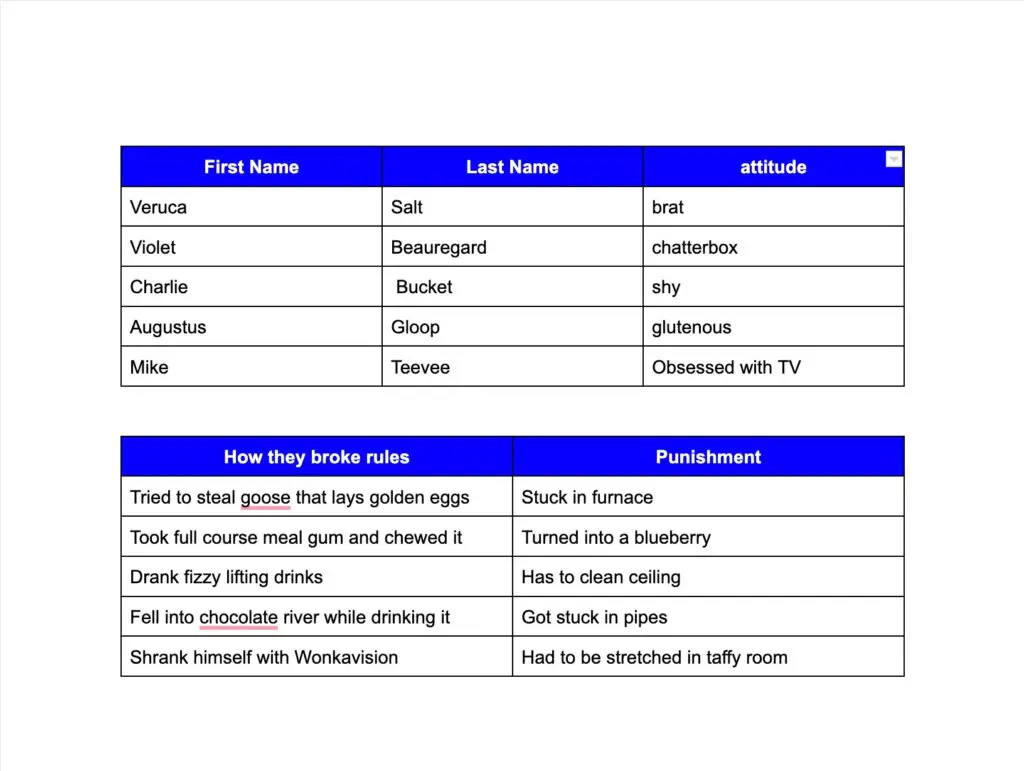
- Your selected cells should now be in a new table as shown in the screenshot below
- Select the cells in the original table, right-click, and select “Delete x columns” where x refers to the number of columns being removed, as shown below.
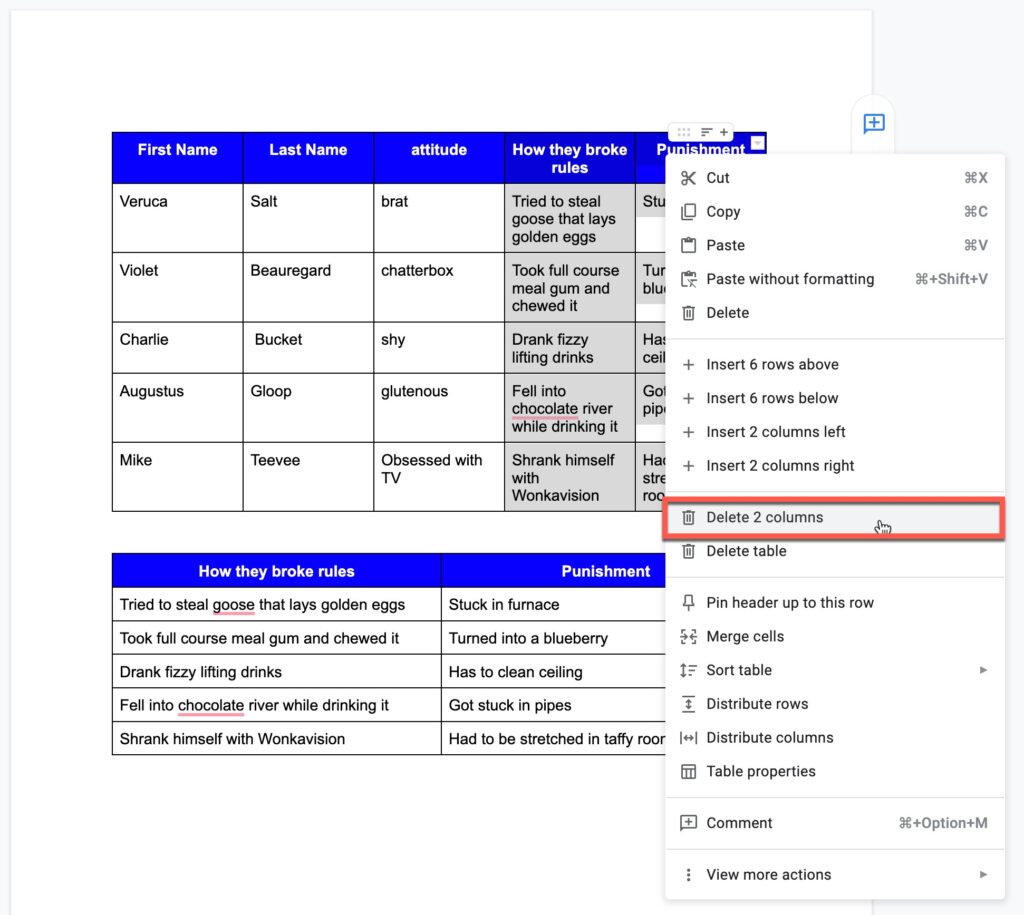
- The table should show that the columns have been removed as shown in the screenshot below
When Should I Use a Table in Google Docs?
Explaining things in detail with language can be beneficial, but some chunks of information are best understood in graph form. What kinds of information would benefit from a table in Google Docs?
- Comparing and Contrasting Features of Products
- Displaying the Results of an Experiment
- Presenting Data from a Survey
- Helping Your Readers Process Complex Information in One Graphic
For those readers who comprehend best through visual displays, a table can be a great way to understand key points and get the most out of your Google Doc.
Tables are also a great way to help break up the monotony of text and make your documents more engaging and enjoyable to read. Can other features be added to a table to make it even more beautiful, and professional?
Our Recommended Office Desk Tech
[amazon table=”17112″]
Color and Visuals Can Make Your Google Docs Tables Pop
While the design of a table in Google Docs is a pleasant departure from lines of text, there are some tricks you can use to make your table or chart even more interesting, and helpful.
Let’s take a look at an example below, comparing and contrasting the features of three different imaginary classic cell phone models.
| FM Radio | Headphone Jack | MP3 Player | Browser | Camera | |
| GBX | ⛔ | ✅ | ✅ | ⛔ | ⛔ |
| XK1 | ✅ | ✅ | ✅ | ✅ | ✅ |
| 033Y | ✅ | ⛔ | ⛔ | ✅ | ✅ |
This table helps your readers process multiple features quickly, and uses emojis and pops of contrasting color to help draw the eye, and make the information easier to process, too.
In the above example, splitting a cell could help add cell phone models or features to the chart without having to redo the entire visual.
You can also add photographs or other images to your table to help give further clarification as to the features or models being presented; simply select “Insert” from the main toolbar and “Image” to add a more engaging visual.
Your chart can also become a link embedded within your Google Doc, thus making sure that your Doc serves as a one-stop source of info for your team or audience. Other techniques can be used to help make your data easier to process while remaining informative.
When Should You Avoid Splitting Tables in a Google Doc?
If you have an especially large amount of information to convey, dividing your table into multiple charts may be ideal. There is only so much information that a single viewer can typically comprehend easily and using separate tables within your Google Doc instead of splitting existing tables can keep your document readable and informative.
A Table that is 18 rows by 10 columns is going to be comprehensive, yet visually massive. The more data you try to squeeze into your table, the more puzzling the information may be. Breaking the data up into two or three carts may help your readers learn more while absorbing the same amount of data.
Conclusion
A table can be split with Google Docs by right-clicking on a cell, selecting “Split Cell”, inputting the desired number of new columns or rows within the existing space, and selecting “Split”. This is a great way to add more information to your table without redoing the entire visual.
Tables are great ways to help lay out the results of surveys or experiments, compare and contrast product features, or convey complex information visually rather than through chunks of text, and the addition of links and images to a table can add to its appeal and usefulness.
If splitting cells is becoming too cumbersome, consider displaying your information across multiple graphs so that your data is easier to read and more engaging.
Sources
https://workspaceupdates.googleblog.com/2022/10/split-table-cells-in-google-docs.html
https://support.google.com/docs/answer/1696711
https://support.google.com/docs/answer/3371015
https://support.google.com/docs/answer/97447
https://support.google.com/docs/answer/7009814